Log Management for Docker Swarm with ELK Stack
View CodeIn the previous article, we covered how to monitor a Docker Swarm. As a follow up, in this article, we will go through setting up a dynamic solution for log management in a docker swarm. We will be collecting logs from all the containers in all the nodes of the swarm. With all this data, we would also be able to do querying and analysis.
We will use the very popular ELK stack from elastic for log management. This includes Elasticsearch, Logstash and Kibana. Elasticsearch is the database to store the log data and query for it. Logstash is a log collection pipeline that ingests logs from multiple sources and feeds it to Elasticsearch. Kibana is the web UI to display Elasticsearch data. We will also deploy logspout to all nodes in the swarm, which will connect to docker daemon in the host to collect all logs and feed it to logstash. All these tools are open-source and can be deployed as a container.
We will use the Docker Swarm Mode to build the cluster and deploy these services as a stack. This allows for us to collect logs from any container without making any changes. Any logs that can be seen with docker logs command will be automatically collected. Also, logs will collected from any new nodes joining the swarm. All the files used for this project can be found here.
The Stack
The tools that we use for log management stack are all open-source. These tools are all container-friendly and easily scalable. Our stack comprises of the following tools.
Elasticsearch
Elasticsearch is a distributed, RESTful search and analytics engine capable of solving a growing number of use cases.
Elasticsearch is essentially a database that store JSON documents, based on Apache Lucene. It is a very powerful and efficent full-text search engine with a REST API. In this article, we will deploy only a single instance of Elasticsearch. However, for any sort of production setup, you would need to setup a cluster of Elasticsearch. To setup an Elasticsearch cluster, check here and here.
Logstash
Logstash is an open source, server-side data processing pipeline that ingests data from a multitude of sources simultaneously, transforms it, and then sends it to your favorite “stash”.
Logstash ingests data from many source, do some processing and then feed it to Elasticsearch. In this demo, we are pushing the logs to a single instance for logstash. We can have multiple instances of logstash and even have a layer of Beats shippers that push logs to logstash.
Kibana
Kibana lets you visualize your Elasticsearch data and navigate the Elastic Stack.
Kibana is a web UI for elastic stack. It lets you see and query the log data. You can create graphs and dashboards with the data. Kibana stores all the information including the graphs in elasticsearch. So, Kibana in itself is stateless and can be scaled independently.
Logspout
Log routing for Docker container logs
Logspout from Gliderlabs is log router that connects to the docker daemon and collects logs from all its container. Here, we use the logstash plugin to push it to logstash. We use the bekt/logspout-logstash image for this. We deploy it to all nodes in the cluster to get all the logs.
Docker Swarm Mode
The first thing to do is to create a Docker Swarm with the docker-machine. We will be creating a swarm with one manager named manager and two workers named agent1 and agent2. To follow along with the demonstration, you need to have the following prerequisites:
Docker: version >= 1.13, to support Docker Compose File version 3 and Swarm Mode.Docker Machine: version >= 0.8Docker Compose: version >= 1.10, to support Docker Compose file version 3
I have explained how to do this in my previous article, Monitoring Docker Swarm with cAdvisor, InfluxDB and Grafana. Follow the steps in the section Docker Swarm Mode of that article to create and setup the Swarm. Once the swarm is setup, you can see the hosts with docker node ls command. The output of this command must look something like this.
ID                           HOSTNAME  STATUS  AVAILABILITY  MANAGER STATUS
3j231njh03spl0j8h67z069cy *  manager   Ready   Active        Leader
muxpteij6aldkixnl31f0asar    agent1    Ready   Active
y2gstaqpqix1exz09nyjn8z41    agent2    Ready   Active
Docker Stack
For elasticsearch to not give Out of Memory errors, we need set vm.max_map_count of the kernel of VMs to atleast 262144. To do this, run the following commands.
docker-machine ssh manager sudo sysctl -w vm.max_map_count=262144
docker-machine ssh agent1 sudo sysctl -w vm.max_map_count=262144
docker-machine ssh agent2 sudo sysctl -w vm.max_map_count=262144
We will define the entire stack for logging in the docker-stack.yml file. This will contain the information about different services including the deploy stratergies. This file will be in the docker-compose v3 format. We can then deploy it with one command. The docker-stack.yml file is given below.
version: '3'

services:
  elasticsearch:
    image: docker.elastic.co/elasticsearch/elasticsearch:5.3.2
    environment:
      ES_JAVA_OPTS: '-Xms256m -Xmx256m'
      xpack.security.enabled: 'false'
      xpack.monitoring.enabled: 'false'
      xpack.graph.enabled: 'false'
      xpack.watcher.enabled: 'false'
    volumes:
      - esdata:/usr/share/elasticsearch/data
    deploy:
      replicas: 1
      placement:
        constraints:
          - node.hostname == agent1

  logstash:
    image: docker.elastic.co/logstash/logstash:5.3.2
    volumes:
      - ./logstash/logstash.conf:/usr/share/logstash/pipeline/logstash.conf
    depends_on:
      - elasticsearch
    deploy:
      replicas: 1

  logspout:
    image: bekt/logspout-logstash
    environment:
      ROUTE_URIS: 'logstash://logstash:5000'
    volumes:
      - /var/run/docker.sock:/var/run/docker.sock
    depends_on:
      - logstash
    deploy:
      mode: global
      restart_policy:
        condition: on-failure
        delay: 30s

  kibana:
    image: docker.elastic.co/kibana/kibana:5.3.2
    ports:
      - '80:5601'
    depends_on:
      - elasticsearch
    environment:
      ELASTICSEARCH_URL: 'http://elasticsearch:9200'
      XPACK_SECURITY_ENABLED: 'false'
      XPACK_MONITORING_ENABLED: 'false'
    deploy:
      replicas: 1

volumes:
  esdata:
    driver: local
We will start by saying that we are using the version 3 of docker-compose file. We have following 4 services in the stack.
elasticsearch
For the Elasticsearch service, we use the offical docker.elastic.co/elasticsearch/elasticsearch image. With the ES_JAVA_OPTS environment variable, we will set the heap space, 256MB as the minimum and maximum here. Also, the official image comes with X-Pack installed, which will take care of security, monitoring, alerting etc. of the elastic stack. For this demo, we will disable the X-Pack. We set xpack.security.enabled, xpack.monitoring.enabled, xpack.graph.enabled and xpack.watcher.enabled as false to do this. We will setup a docker volume named esdata mounted at /usr/share/elasticsearch/data to store all Elasticsearch data. In the deploy key, we are saying that we need one copy of it. We are placing this service in agent1 node. This is done to make sure that the volume is always in that host.
logstash
We will use the official docker.elastic.co/logstash/logstash image for logstash. We also need to setup a custom configuration file for logstash to define its pipeline. The configuration file logstash.conf is given below.
input {
  udp {
    port  => 5000
    codec => json
  }
}

filter {
  if [docker][image] =~ /logstash/ {
    drop { }
  }
}

output {
  elasticsearch { hosts => ["elasticsearch:9200"] }
  stdout { codec => rubydebug }
}
The config file contains three sections. The input section defines where logstash is listening for log data. In this case, logstash will listen at port 5000 where log will be coming in json format and using UDP protocol. The filter section can do some processing with the log data. Here, we will drop all the logs coming from logstash image, as those are duplicates. The output section defines where logstash is feeding the data to. Here, we will send it to elasticsearch service at port 9200. We will use the rubydebug codec as it will use Ruby Awesome Print library to pretty-print the data.
Put this file, logstash.conf in a folder named logstash. We are creating a volume to share this file at the location /usr/share/logstash/pipeline of the container. This will then be read automatically when logstash starts up. Also, this service depends on Elasticsearch as it feed data to it. As before, we only need one copy of this service.
logspout
For logspout, we use bekt/logspout-logstash image. This image contains logspout with logstash plugin. We need to provide the ROUTE_URIS environment variable with the location of logstash. In this case, it is logstash:5000 with logstash protocol. We also need to create a volume for the Docker socket, /var/run/docker.sock. This lets the container to attach to the docker daemon in the host and collect all the logs. This service depends on Logstash as it feed data to it. We need to deploy this service to all the nodes. So we use the global mode for deploy. Also, there is a chance for this service to fail bacause logstash is not ready. So, we setup a restart policy that restarts the service if it fails with a delay of 30 seconds.
kibana
We use the official docker.elastic.co/kibana/kibana image and expose the port 5601 of the container to port 80 of the host. The router mesh feature will then let us access kibana from port 80 of any host in the swarm. This service get data from Elasticsearch, so depended on it. We need to set the ELASTICSEARCH_URL to the elasticsearch service, http://elasticsearch:9200 in this case. We also set the XPACK_SECURITY_ENABLED and XPACK_MONITORING_ENABLED environment variables as false, to disable X-Pack. Here also, we only need one instance of this service.
Finally, at the end of the file, we have the volumes key with the esdata volumes. We are using the local driver for this so the data will be stored in the host containing the service. As Elasticsearch service is placed in agent1, the volume is always present there.
To deploy this stack, save the above file as docker-stack.yml and run the following command.
docker stack deploy -c docker-stack.yml elkThis will start the services in the stack named elk. The first time takes more time as the nodes have to download the images. To see the services in the stack, you can use the command docker stack services elk, the output of the command will look like this.
ID            NAME                   MODE        REPLICAS  IMAGE
07h9zishcka5  logging_logspout       global      3/3       bekt/logspout-logstash:latest
7upb3emlhsft  logging_kibana         replicated  1/1       docker.elastic.co/kibana/kibana:5.3.2
puxx0x4txa50  logging_logstash       replicated  1/1       docker.elastic.co/logstash/logstash:5.3.2
wyjkad4do7oi  logging_elasticsearch  replicated  1/1       docker.elastic.co/elasticsearch/elasticsearch:5.3.2
You can see the running containers in the stack with the command docker stack ps elk. Its output will look like this.
ID            NAME                                        IMAGE                                                NODE     DESIRED STATE  CURRENT STATE               ERROR                      PORTS
jqr1m6ts21p3  logging_logspout.pt27y28y0t5zzph3oi72tmy58  bekt/logspout-logstash:latest                        agent2   Running        Running about a minute ago
4zwvtt3momu3  logging_logspout.9m6jopba7lr0o40hw9nwe7zfb  bekt/logspout-logstash:latest                        agent1   Running        Running about a minute ago
mgpsi68gcvd9  logging_logspout.ub1sl7d5fy9dbnlx8um67a03t  bekt/logspout-logstash:latest                        manager  Running        Running about a minute ago
unz9qrfit8li  logging_logstash.1                          logstash:alpine                                      agent1   Running        Running 2 minutes ago
jjin64lsw2dr  logging_kibana.1                            docker.elastic.co/kibana/kibana:5.3.0                agent2   Running        Running 2 minutes ago
orzfd05rzq8e  logging_elasticsearch.1                     docker.elastic.co/elasticsearch/elasticsearch:5.3.0  agent1   Running        Running 3 minutes ago
Setup Kibana
Once the services have started, you can open kibana with the following command:
open http://`docker-machine ip manager`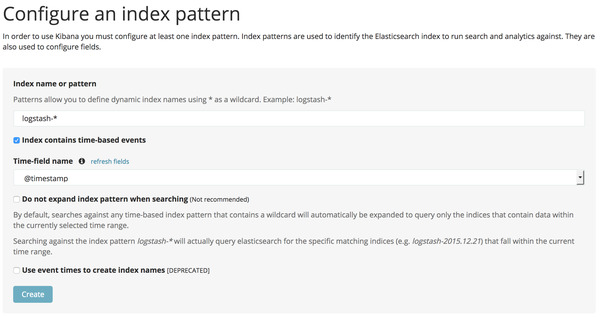 Add Default Index Pattern
It might take some time for kibana to load up. So, if the page doesn’t load up, wait for a few minutes and try again. The first time kibana is opened, it will ask to specify a default index pattern. Logstash will create index starting with logstash-, so the default index pattern is logstash-*. Also the Time-field name is @timestamp. This is the field that stores the time when the log entry is made. Click on the Create button to set it up. Now go to the Discover tab to see all the log entries. To the left, you can see all the fields indentified from the logs. If you click on any field, you can see the top values and its percentages. The docker.image field will give the docker image used, the docker.name field gives the container name, etc.
To test this setup, we will deploy another stack and see its logs from here. For this we will use a simple stack containing a single service. It will be nginx webserver serving a static webpage. The image used for this is hanzel/nginx-html and we expose port 80 of the container as port 8000 in the host. Also, we deploy 5 instances of this service, just to see logs from different instances. The stack file for this stack nginx.yml is given below.
version: '3'

services:
  nginx:
    image: hanzel/nginx-html
    ports:
      - "8000:80"
    deploy:
      replicas: 5
We will deploy this stack using the command,
docker stack deploy -c nginx.yml nginxYou can see the services in the nginx stack with the command docker stack services nginx. The output of the command will look something like this.
ID            NAME         MODE        REPLICAS  IMAGE
dl8k8w2wief5  nginx_nginx  replicated  5/5       hanzel/nginx-html:latest
You can open up the nginx webserver with the following command
open http://`docker-machine ip manager:8000`Refresh the page a few times to generate some log entries. Now you can see the logs in Kibana. Use the query docker.image: nginx AND (200 OR 304) in Kibana. This filter will fetch the log entries where the docker image name contains nginx and the log message contains 200 or 304. If you look at the docker.image field on the left, you can see that we are reading logs from multiple containers across different hosts.
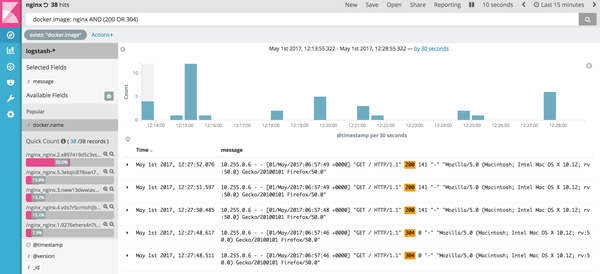 Kibana logs for nginx
Conclusion
In this article, we have deployed a dynamic log management solution for our docker swarm. Once the stack is setup, logs are automatically collected from all the containers across all the hosts in the swarm. To do this, we have used popular open-source tools like Elasticsearch, Logstash, Kibana and Logspout.
Once you are done with the demonstration, you can remove the stack with command,
docker stack rm elk
docker stack rm nginx
If you are done with the VMs created for the demo, you can stop and remove then with the following commands,
docker-machine stop manager agent1 agent2
docker-machine rm -f manager agent1 agent2